
The world is full of ideas - but it is actions that change it.
At Berenberg, we turn our clients‘ ambitions into reality - with passion, dedication, and the highest standards for ourselves, we create sustainable solutions that truly matter.
As a bank, we are different: driven by entrepreneurial spirit, decisiveness, and pragmatism. Since 1590, we have combined traditional knowledge with strategic foresight and cutting-edge technology.
Our strength lies in balance: we are large enough to offer comprehensive services, yet agile enough to act swiftly and decisively. Thanks to our expertise across various business areas, we understand the needs of diverse client groups and build long-term partnerships.
Our goal: to create what lasts and improve what is already there.
We act today to shape tomorrow - for and with our clients.
18
international offices
39 bn Euro
Assets under Management
1500
employees worldwide
From cloth trading to an internationally active private bank – a look into our history
Founded in 1590 by Hans and Paul Berenberg, the company evolved from an international trading house into a bank. Each generation has not only embraced change but actively shaped it – whether in the 17th century with the transition to banking or after World War II with a decisive new beginning.
Today, Berenberg successfully balances scale, agility, and customer focus. We are large enough to offer complex solutions – yet structurally agile enough to act quickly and individually.
How we operate today
With a clear focus on innovation and progress, Berenberg is strategically investing in the expansion of digital services, the development of targeted investment solutions, and the exploration of forward-looking technologies. This includes the integration of Artificial Intelligence, setting new standards in analysis, decision-making, and client service. Through this strategic approach, Berenberg aims not only to meet market demands but, above all, to meet the high expectations of its clients. The ambition remains unchanged: to balance tradition with innovation and create a stable, future-proof foundation for success.


Our values
Ambition
Since 1590, we have been passionately moving forward – shaping the future together with our clients.
Creativity
Courage and openness define our thoughts and actions – this is how we find the best solutions for our clients.
Responsibility
Responsible, discreet support at the highest level – our corporate identity creates long-term relationships.

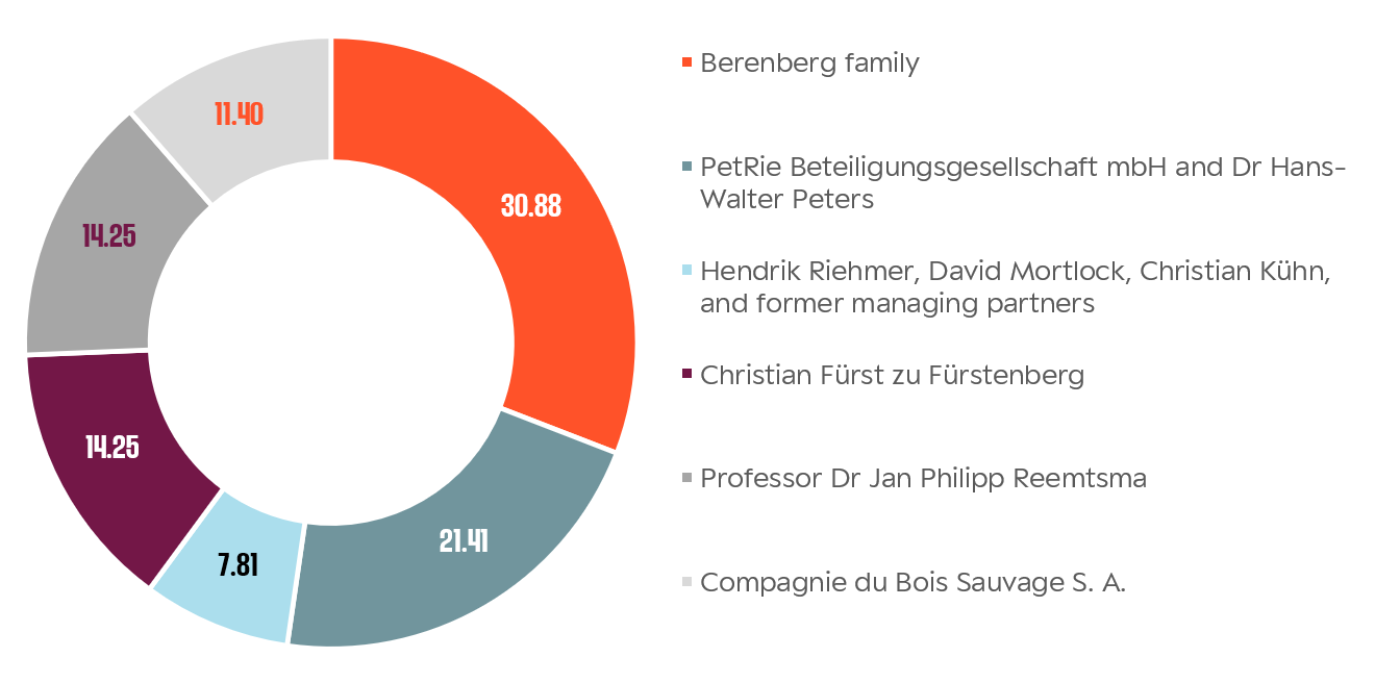
Shareholders (respective holdings in %)
Key performance indicators
| 2019 | 2020 | 2021 | 2022 | 2023 | 2024 | ||
|---|---|---|---|---|---|---|---|
| Net profit for the year | € million | 61 | 108 | 170 | 55 | 55 | 82 |
| Total assets | € billion | 5.1 | 4.7 | 6.4 | 7.7 | 6.7 | 6.4 |
| Equity | € million | 288 | 296 | 341 | 342 | 343 | 350 |
| Return on equity (before taxes) | % | 28.5 | 52.0 | 82.7 | 28.7 | 29.3 | 40.1 |
| Cost-income ratio | % | 79.9 | 70.9 | 65.8 | 79.0 | 80.7 | 76.2 |
| Assets under management | € billion | 40.7 | 41.3 | 44.8 | 38.5 * | 37.7 | 39.0 |
| Employees (Berenberg Group) | 1,474 | 1,573 | 1,703 | 1,579 | 1,536 | 1,528 | |
| * adjusted for divested business | |||||||